
1
2
3
4
5
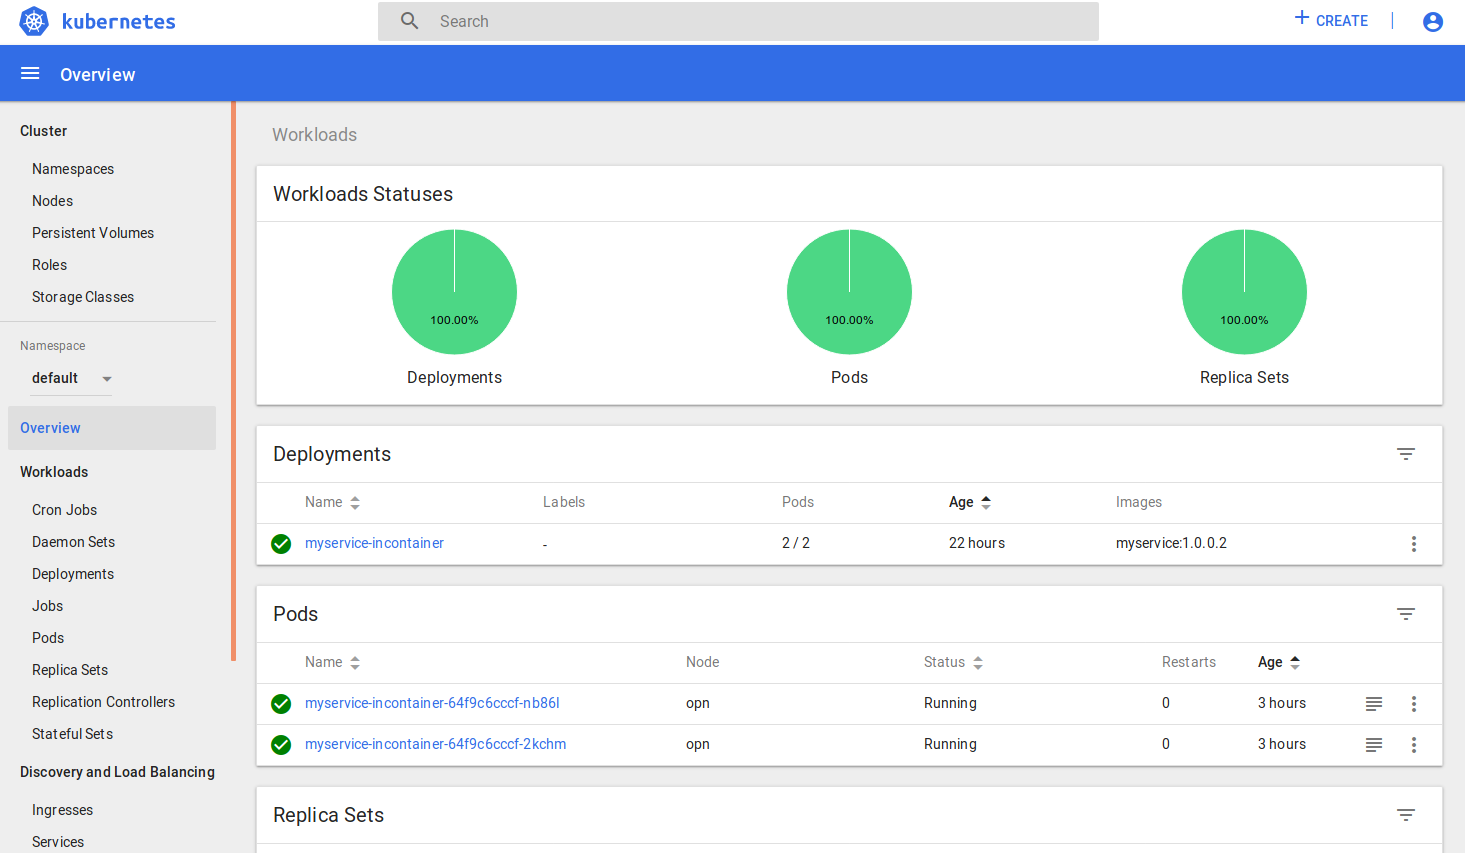
Kubernetes Dashboard
The main dashboard available for Kubernetes that will give you information relating to the Containers, Pods, Deployments etc. that you have deployed in your cluster. This information is all replicated via the kubectl command, but the visualisation is handy. The two most useful items are accessed by clicking on Pods, then a specific Pod instance. The top navigation in a Pod will let you launch a shell into the container or view the Pod logs (useful for the istio-ingressgateway when trying to debug route failures).
Url
http://localhost:8001/api/v1/namespaces/kube-system/services/https:kubernetes-dashboard:/proxy/#!/overview?namespace=default
Launch Codes
kubectl proxy
Envoy Administration
The main benefit I found with envoy is the ability to quickly check any applied Istio policies. Click on configdump and either browse or search for your host e.g. myservice-service and route_config. You’ll see the match prefixes that have been assigned, or more importantly, if they’re missing, you know you’ve got an incorrect template.
Url
http://localhost:15000
Launch Codes
kubectl -n istio-system port-forward $(kubectl get pod -n istio-system -l app=istio-ingressgateway -o jsonpath='{.items[0].metadata.name}') 15000
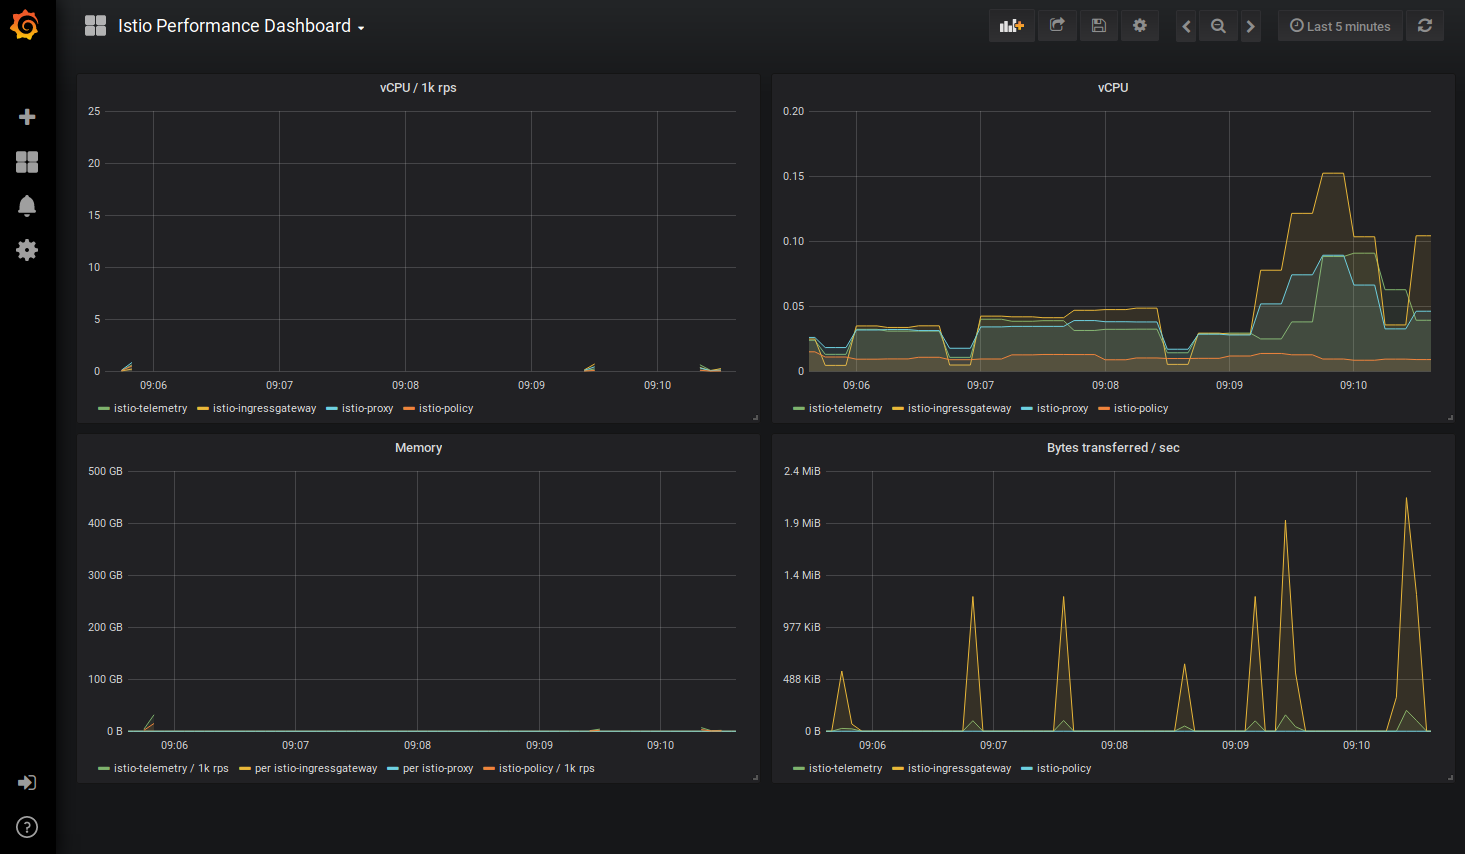
Grafana Dashboard
The Grafana dashboards are useful when you’ve got everything up an running, especially when you’re performing Load Testing against your cluster. I used the Performance Dashboard the most, followed by the Workload Dashboard.
Url
http://localhost:3000
Launch Codes
kubectl -n istio-system port-forward $(kubectl -n istio-system get pod -l app=grafana -o jsonpath='{.items[0].metadata.name}') 3000:3000 &
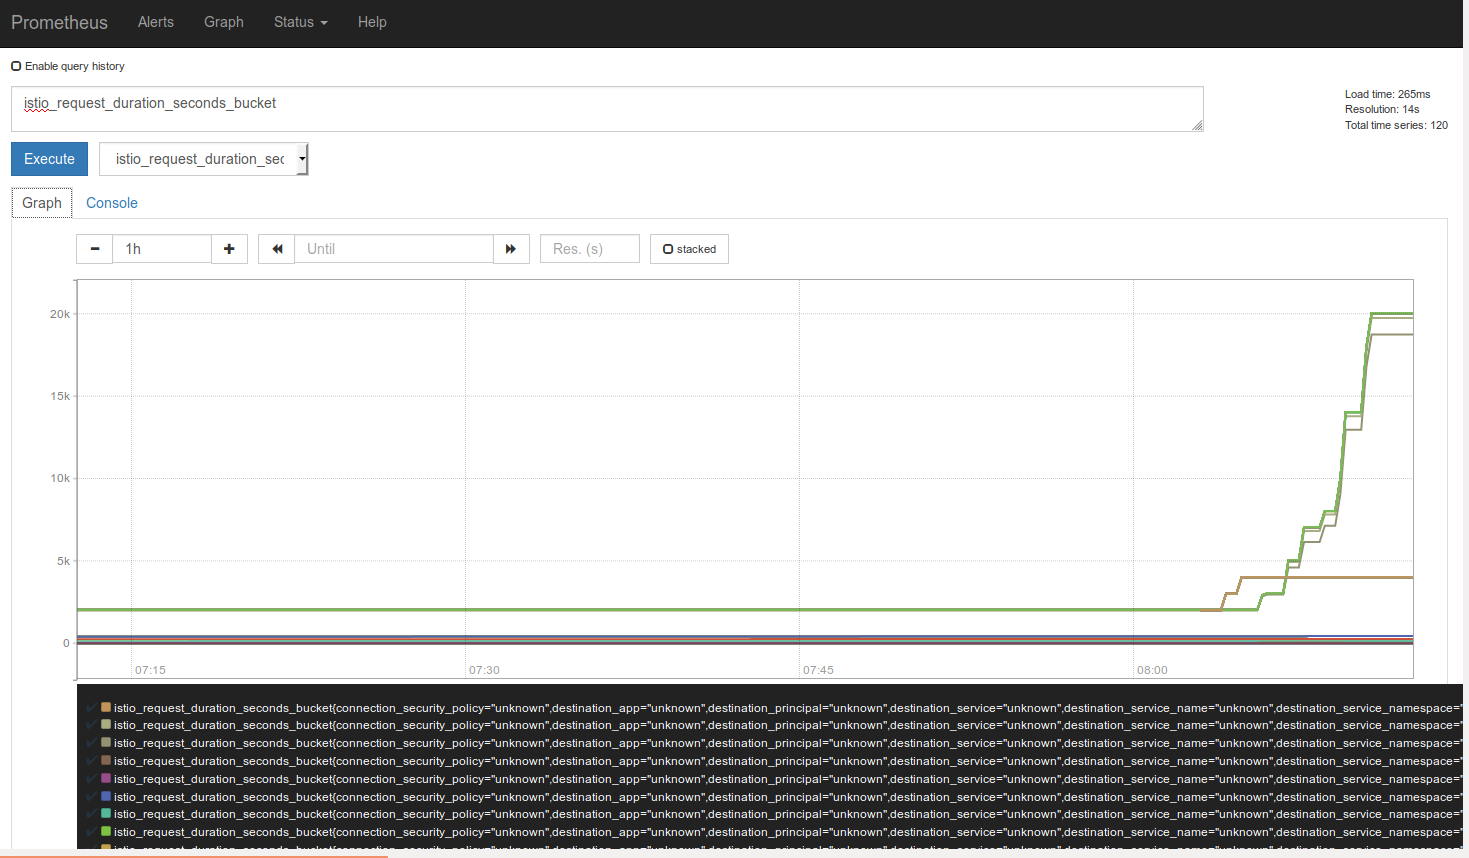
Prometheus Dashboard
I spent the least amount of time on Prometheus, but I wasn’t needing to debug any estoeric problems apart from the incorrectly assigned container network address range which Prometheus didn’t help with. However, there are large amount of captured metrics which will assist your performance and failure analysis.
Url
http://localhost:10010
Launch Codes
kubectl -n istio-system port-forward $(kubectl -n istio-system get pod -l app=prometheus -o jsonpath='{.items[0].metadata.name}') 10010:9090 &
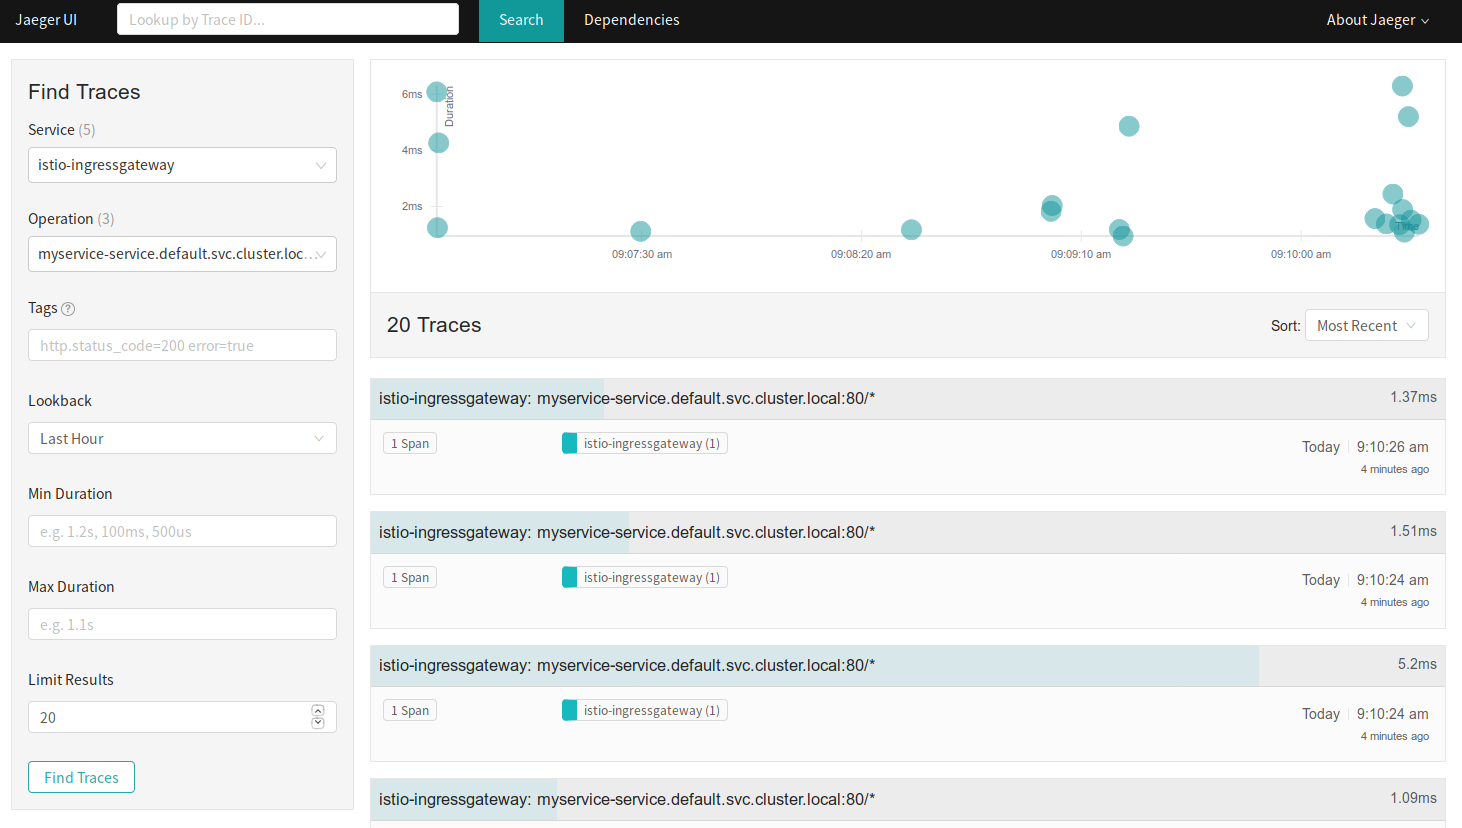
Jaeger Dashboard
In short, I used Jaegar a lot, mainly because I was trying to find why my ingress-gateway wasn’t forwarding packets to the istio sidecar when everything else appeared to be wired correctly. Two big benefits of Jaegar. The first (after clicking on a trace result) is seeing where in the container hop sequence your packets are being dropped and second, seeing the segment timings for debugging which of your containers are adding the most latency in to the request/response cycle.
Url
http://localhost:16686
Launch Codes
kubectl port-forward -n istio-system $(kubectl get pod -n istio-system -l app=jaeger -o jsonpath='{.items[0].metadata.name}') 16686:16686 &